I'm just finishing a week long
workshop on programming with Python at Carnegie Mellon University. I started knowing nothing, but found that I like the language. The week ends tomorrow with a presentation of something we developed using Python that applies to our profession. I teach a lot of Astronomy, but there is already so much out there. I didn't think I would be contributing much. But, I also teach the Earth Sciences, and was hard pressed to find anything out there in Python that was very useful. So I played around the graphing ability of Python, and discovered that I could use Python to create Climographs. So that became my project. I realize that it's not going to change the world, but it's simple to use. I went to
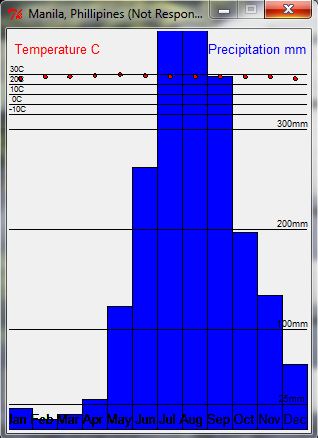
http://www.worldclimate.com/ searched a few cities like- Pittsburgh Pa. Bangkok Thailand , OMG it's cold-Barrow Alaska, and my heart's in San Francisco. Here's what I made in just a few minutes
If you teach meteorology, climatology , environmental science, biomes etc, this is for you. It's easy to take a look at the
Koppen Climate types and produce these easy to see graphs in less than a minute.
I will add a few more things to this, but you must admit, it's not bad as is. Now you, or your students can stop wasting class time coloring in graph paper ( though I realize that there is great value in teaching graphing skills)
Or, they can graph by hand, and you can show the solution ! win, win
Update: Non- fatal flaw that I need to fix. Some climates get more than 400mm of rainfall in a month. I will adjust the (win) later
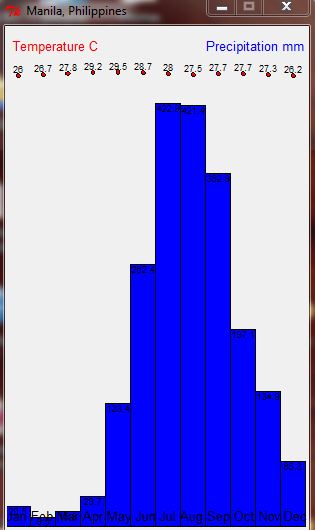
UPDATE: 21 Jul- Made a version that gives a bit more data, and will do the wettest climates